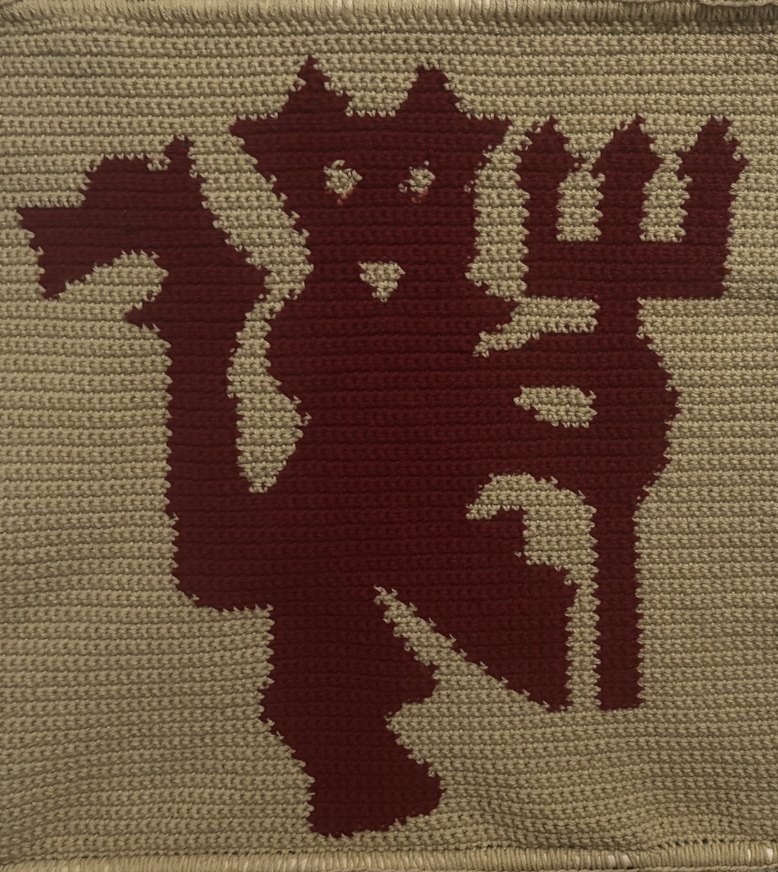
A picture, one stitch at a time
Tapestry crochet is colorwork. You carry the yarn you aren't using inside your stitches, and switch colors when the chart tells you to. Every stitch is one cell in a grid, so a finished piece is really a low-resolution image made of yarn.
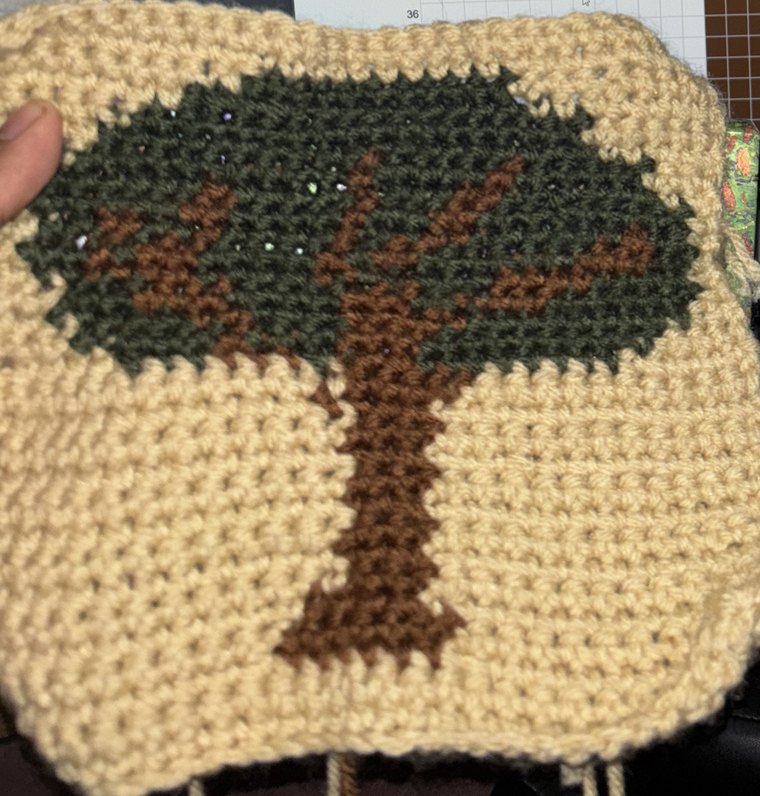
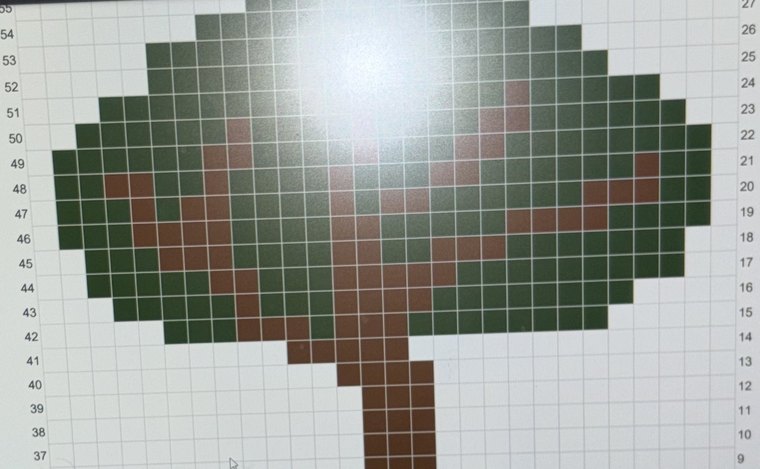
Getting from a picture to a chart is the step TapestryCrochet does for you. You upload an image, pick a width and height from 20 to 100 stitches, and pick 2 to 8 colors. You get a chart you can recolor, export as text, HTML or JSON, and work through row by row with notes. All of it runs in the browser, so your picture never leaves your computer.
I posted it on Reddit when I launched it, and that post brought in 500+ users.
Step 1: make the picture small
The app draws your image onto a canvas exactly as many pixels wide as you want stitches. Each pixel becomes one stitch, so 40 by 40 is already 1,600 stitches. It doesn't correct for the fact that a stitch isn't perfectly square.
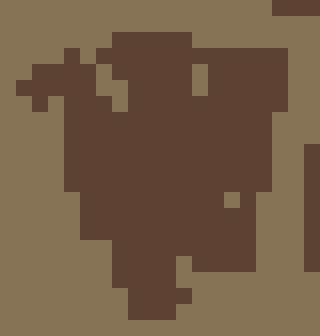 20 wide
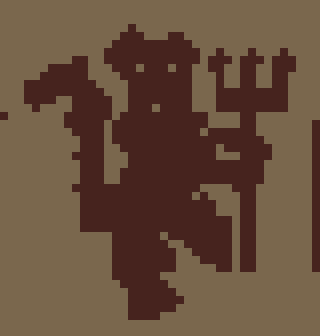 40 wide
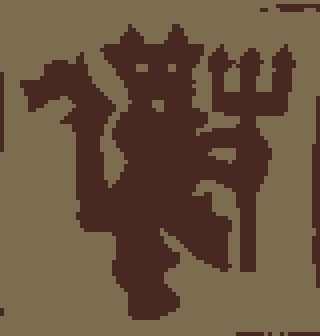 80 wide
Step 2: find the yarn colors
A photo has thousands of colors and you own a few balls of yarn. So picture every color as a point in 3D space, with red, green and blue as the axes. Now the job is to pick the k points that best stand in for the whole cloud. That's k-means clustering:
- Pick k colors from the image at random as starting centers.
- Assign every color to its nearest center.
- Move each center to the average of the colors assigned to it.
- Repeat until nothing changes.
“Nearest” needs a definition, because your eye doesn't treat red, green and blue equally. The clustering weights green the most and also compares brightness:
d² = 2Δr² + 4Δg² + 3Δb² + ½ΔL²
L = 0.2126r + 0.7152g + 0.0722b
Each stitch then gets the number of its closest yarn, and the chart is just those numbers in rows:
Row 1: 1 1 1 2 2 1 1
Row 2: 1 1 2 2 2 2 1
The bug I found writing this
Rereading the code for this post, I noticed step 4 never happens. Here's the check for whether the centers have stopped moving:
let assignments = new Array(colors.length);
// ...
hasConverged = assignments.every((a, i) => a === newAssignments[i]);
On the first pass, assignments is an array of empty slots, and every skips empty slots. With nothing to check it returns true, so the loop quits after one round.
I measured what that costs on my tree photo, at 40 by 40 with 3 colors, over 200 random starts. One round averaged a squared color error of 828 per stitch. Letting it run until it settled averaged 427, about half. The worst start was 4,821 against 777.
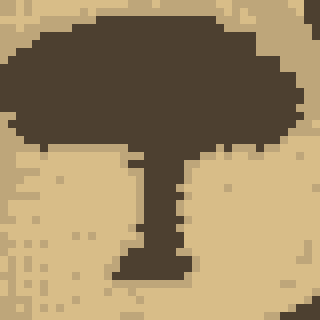 One round, as the code runs today
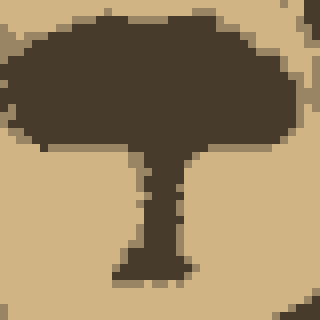 Run until it settles
People were getting usable charts from one round of k-means, which says something about how forgiving yarn is. The fix is one line: fill that first array with -1.
The code is on GitHub.